It Just Isn’t Enough
4 years, 23 days, 21 hours, 34 minutes
29 June 2025
Four graphs that tell you everything you need to know.
Four graphs that tell you everything you need to know about the dire situation the world is still in, roller-coastering towards, and surely through, 1.5 degrees and then onto 2 degrees and so on. Four graphs, courtesy of the immensely detailed 2025 Energy Institute Statistical Review of World Energy, in partnership with KPMG and Kearney, which tell the story in dozens of pages of data of energy demand and supply in 2024. Last year, on almost exactly the same day, I wrote that the 2024 edition (covering 2023 data) was one of the most depressing reports I had ever read. (cf. ‘A Review of World Energy, 28 June 2024’). This one, sadly, is no better, despite a heroic attempt at trying to make us feel better by telling us how much fossil fuel use has been avoided by the rising supply of renewables and nuclear energy. But what really matters is set out in these four graphs I have lifted from the report.
Yes we need growth, for countries that are still developing. Yes we need to manage an orderly, just, transition, away from fossil fuels. But graphs like these tell me that still the world collectively isn’t serious about doing everything possible to reduce our emissions. Indeed at a macro level it feels like we aren’t really trying at all. None of that disparages all the progress that is being made. But unfortunately, it just isn’t enough.
Graph 1. Total energy demand rises again, by 2%, to the highest ever level. Wind and solar grew 16%, much faster than other sources, but because of higher total demand, fossil fuel use also grew, by over 1%.

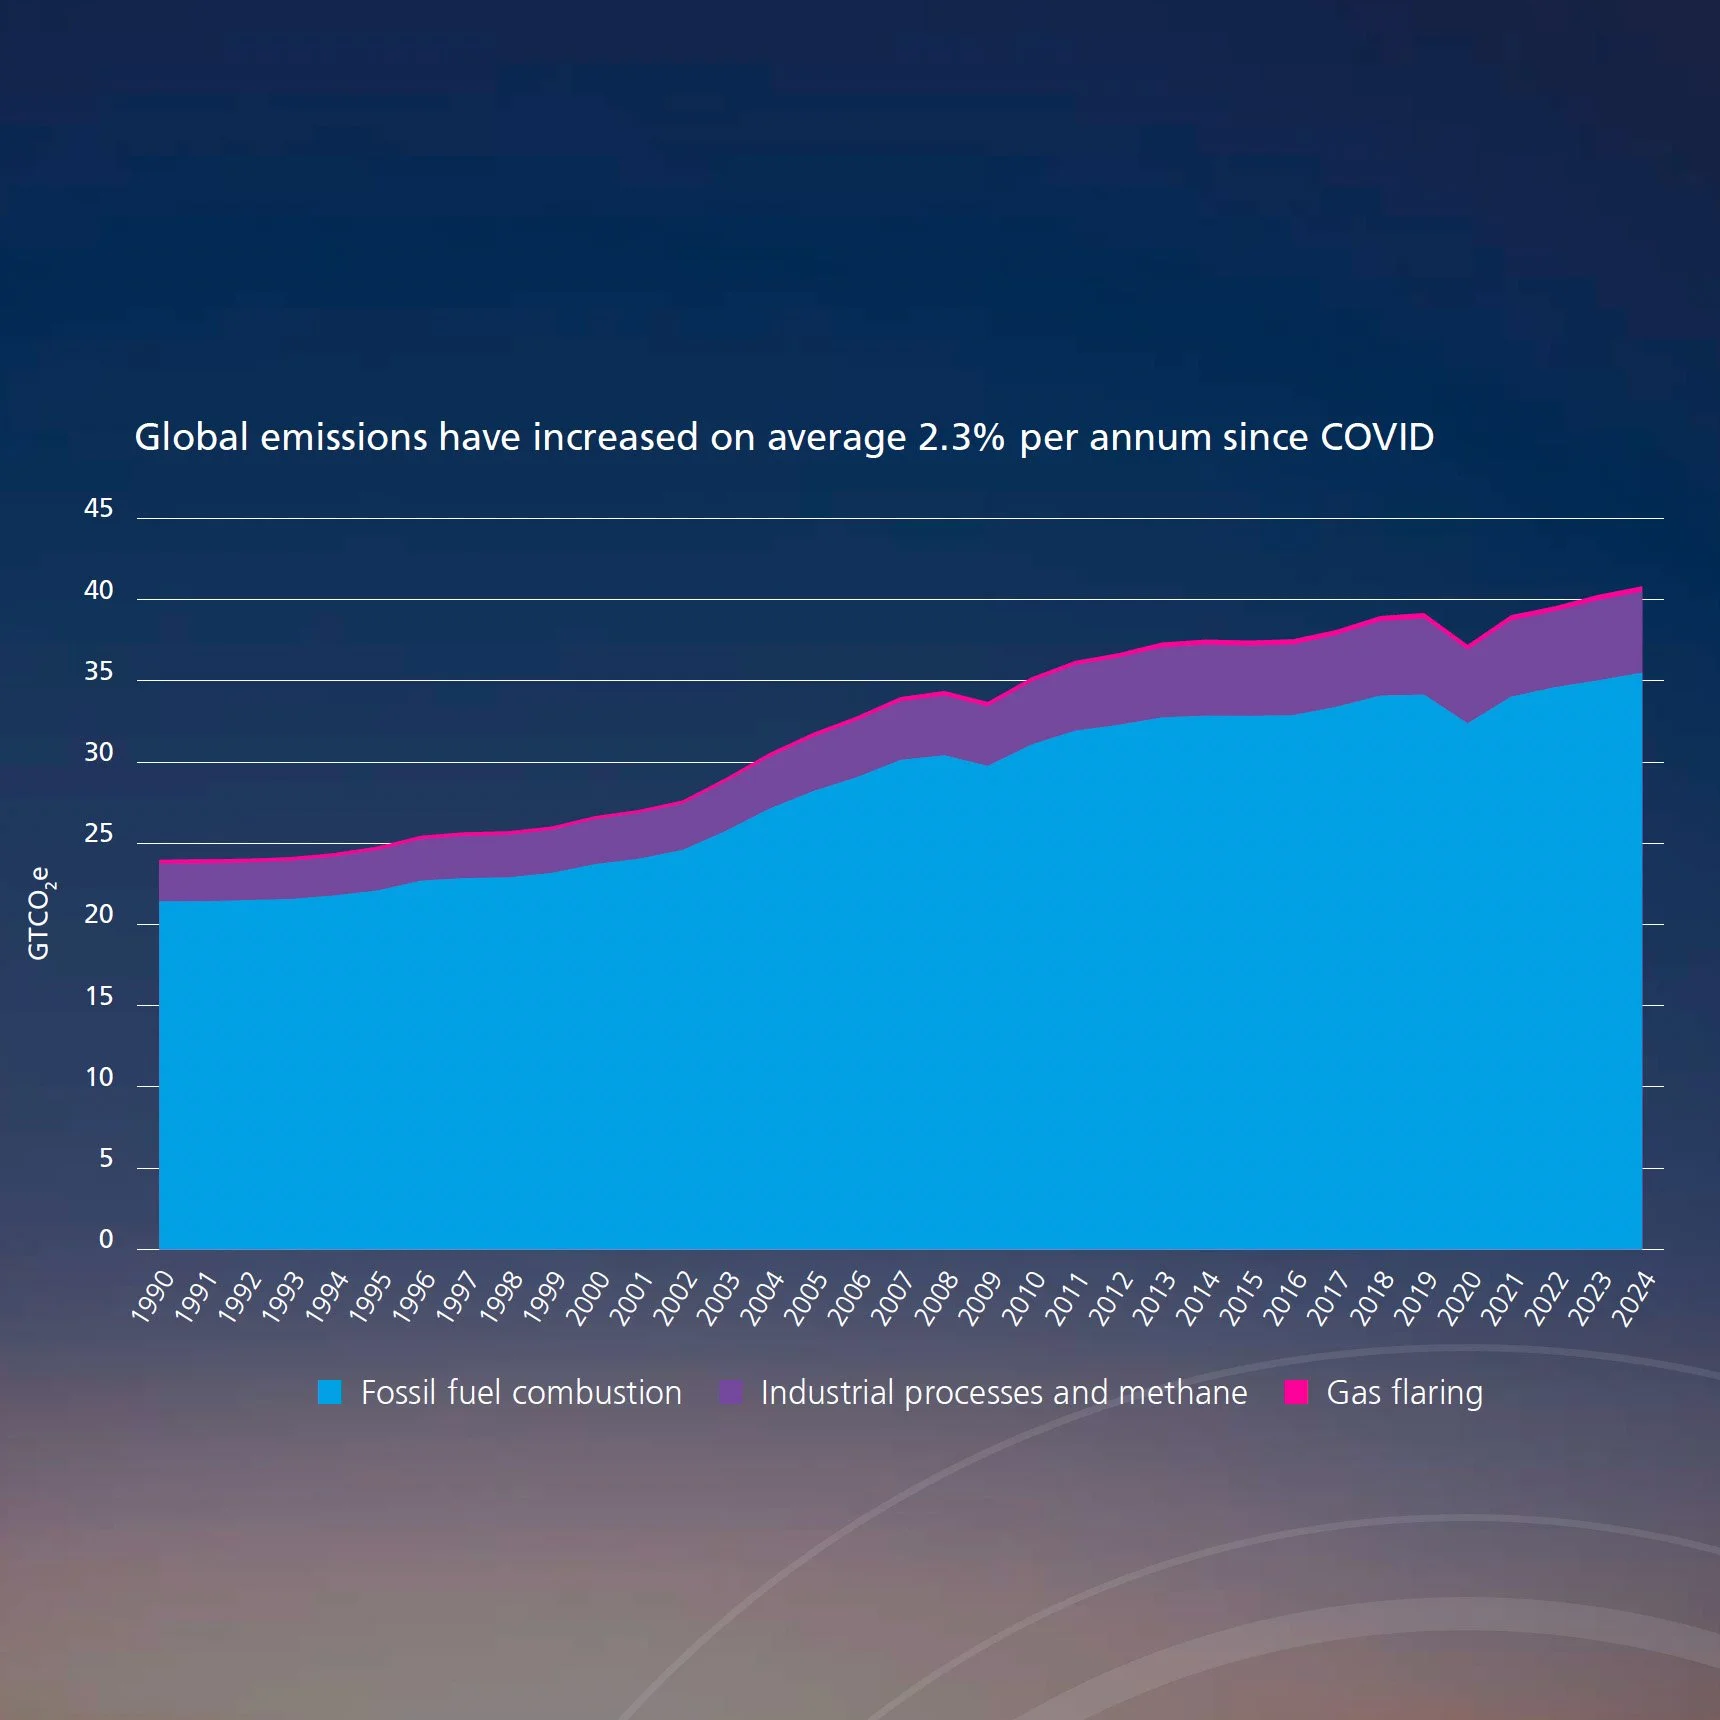
Graph 2. Global carbon emissions from energy use rise again, by 1%, to the highest ever level. Peak carbon continues to evade us as demand for energy continues to grow.
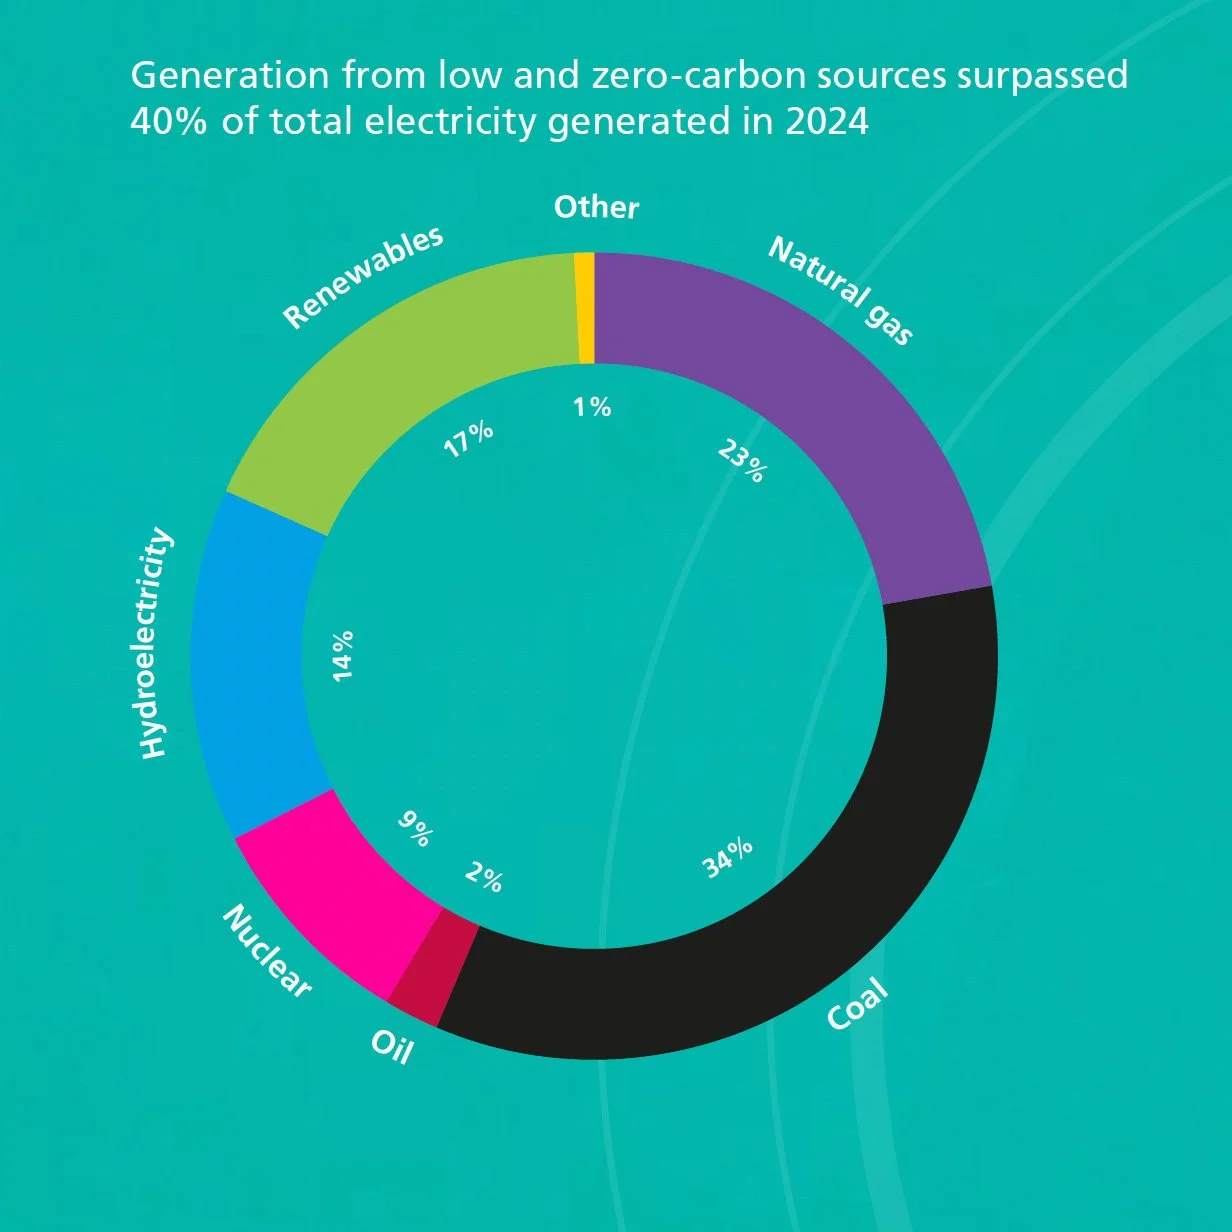
Graph 3. Electricity demand grows by 4%, faster than total energy demand, evidencing the shift toward electric. China is responsible for nearly 60% of new solar. But coal and gas still dominate.
Graph 4. Coal production rises again, to a record high, entirely driven by Asia Pacific, with China as the largest producer.
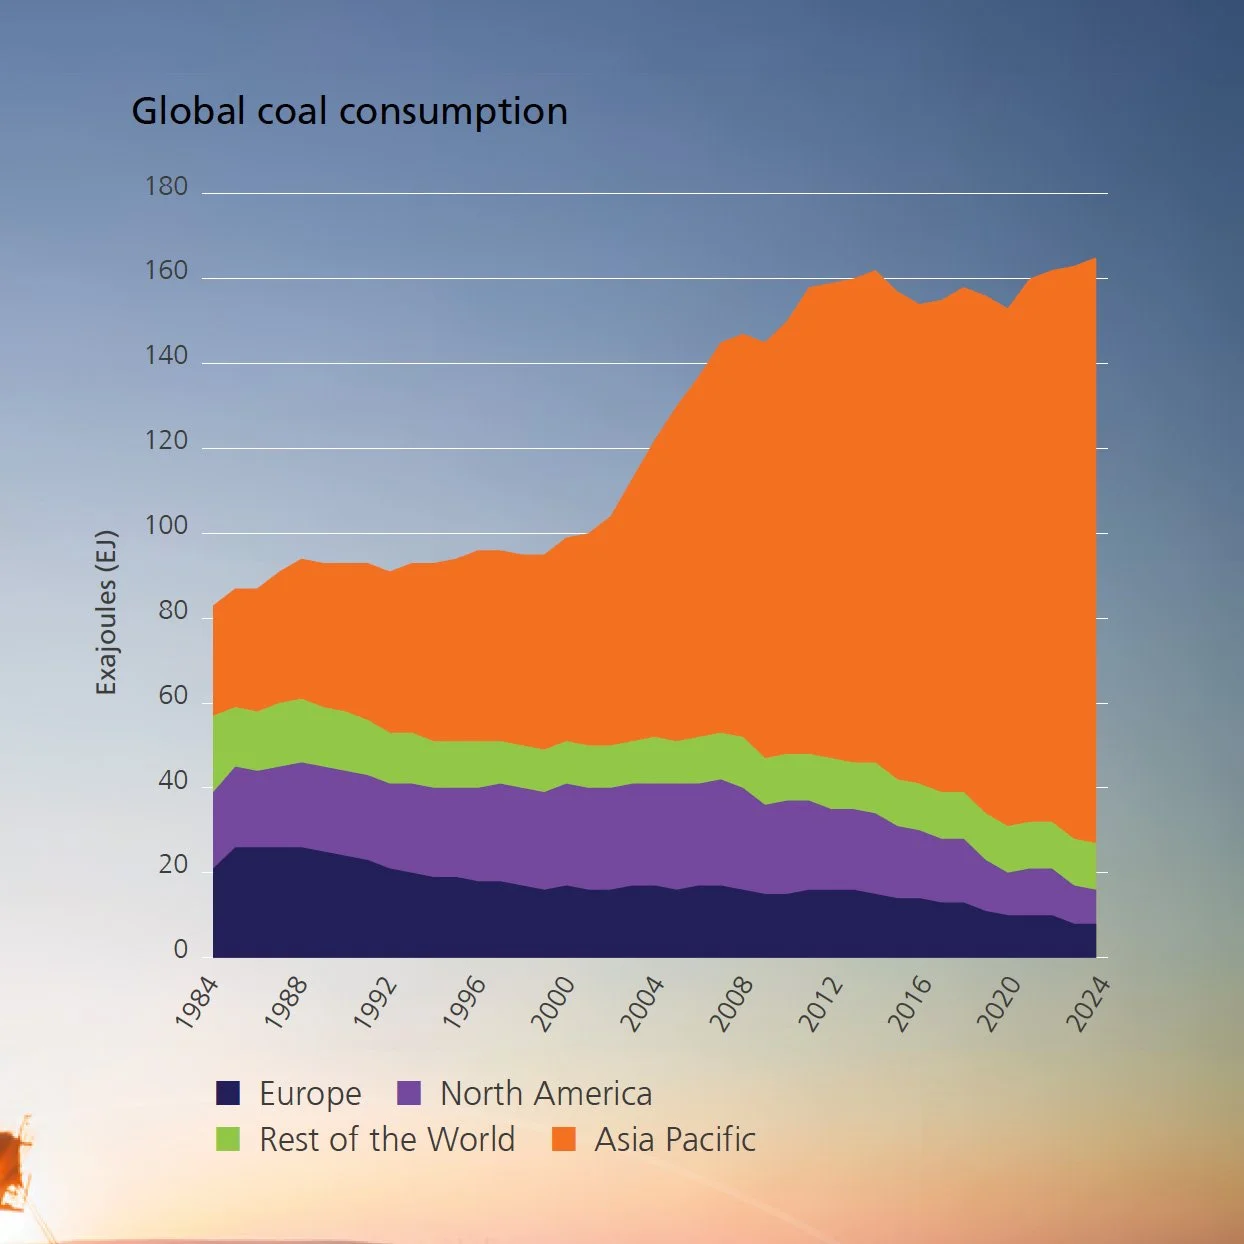
Image credits: The Energy Institute